Reflectance Transformation Imaging in Daguerreotype Investigation
Presented at the Society for Imaging Science and Technology’s Archiving 2017 Conference.
To download the software, or for more details on the algorithms, see the Software Repository
For software release notifications, please signup for the newsletter.
Hembo Pagi, Archaeovision, Tallinn, Estonia
James Miles, Archaeovision, Southampton, United Kingdom
Andres Uueni, Archaeovision, Tallinn, Estonia
Stephen Hogarth, shogarth.com, Calgary, Canada
Kadi Sikka, Estonian Photographic Heritage Society, Tallinn, Estonia
Abstract
Reflectance Transformation Imaging (RTI) has been used for cultural heritage documentation since its introduction by Tom Malzbender in 2001. The technique allows for the recording of 3D surface reflectance properties and visualise them as 2D interactive images. The method can be used to investigate objects in various lighting conditions to enhance small surface changes, to bring out cracks, tool marks, scratches, pencil impressions and many more features that are not visible to the naked eye. The method is a valuable tool when examining coins, writing tablets and daguerreotypes, as features such as fine polishing lines, retouches and deteriorations can be identified.
In this paper, an outline of the RTI technique will be given and a case study will be provided that encompasses a new processing algorithm for RTI that can extract greater levels of information than was previously available.
Introduction
Raking light has been used for inspecting paintings and objects to gather information about the relief and surface topography [1]. The effect of low angle light illumination, those that are almost parallel to the object surface, create strong shadows that enhance the visibility of small topographical changes. The same effect can now be digitally recreated through Reflectance Transformation Imaging (RTI) and is not limited to specific angles and directions, rather, all angles and all directions of the hemispherical space can be included. Through the addition of RTI examinations, users have the ability to relight an object digitally and the method can enhance the digital outputs via filters based on several mathematical algorithms.
RTI was invented by Tom Malzbender from Hewlett Packard Laboratories [2] through the introduction of the mathematical algorithm known as Polynomial Texture Mapping (PTM). In this first paper, the method was used on archaeological artefacts such as writing tablets and funerary statuary. Since then, the method has evolved and has been used on a variety of applications, such as in forensics [3]; classical text based research [4]; Egyptological examinations [5]; numismatics research [6]; community driven churchyard documentation projects [7]; rock art engravings [8]; and large statues [9], plus many more different archaeological assessments.
The case study that follows focuses on the use of RTI on daguerreotypes from the documentation project conducted in collaboration with Estonian Photographic Heritage Society. The aim was to document all the known daguerreotypes in Estonia.
Reflectance Transformation Imaging (RTI)
RTI is a technique that is based on a set of photographs that are taken from the same position, using the same camera settings (exposure, white balance, focal point etc). An external light source (flash or continuous light that is stronger than the ambient light) is used to provide a series of shadows onto an object’s surface and these are recorded by the camera that is in a fixed position. The position of the light source is important and needs to be set at three times the longest length of the recorded object. This light position needs to remain at a constant distance throughout the data capture and should be moved around the object of interest to cover a “dome like” area. In total between 40 and 70 images are recorded in one data capture, with each image recording a different light position. Through the collection of these images, a number of different shadows are recorded, each providing different observations of the surface detail.
These images are then processed and fitted as one interactive image which can be digitally manipulated. Importantly, the fitted interactive image is not a composite image, rather, each of the original photographs are stored within the file and are displayed when specific views are requested. The generated results are based on a mathematical calculation, where light illuminates the object based on the topographical information extracted from the images. The lighting calculations are based on each pixel of the images captured. Any movement in the camera during the capturing process will result in the final data providing incorrect calculations, making the data ineffectual. The topographical information that is expressed through these calculations are based on the surface normals of the images, which the RTI processing software is able to calculate. Surface normals are vectors (Figure 1), perpendicular to the surface at any given position. This provides three-dimensional shape information that is visualised in a two-dimensional space, sometimes referred to as being “two-and-a-half dimensional”. Within the RTI viewing software, users have the ability to move the virtual light-source in any direction from which the topographical information is used to visualise the light behaviour and reflections on the surface. If the topographical information can be calculated, processing of the colour information can be more complicated as the RTI output is an estimated chromatic adoption. RTI colour information is a fusion of different lighting illumination and reflection. In some instances, depending on artefact chromatic characteristics, the output can have tonal banding due to the 8-bit colour JPEG format that is required in the processing of the RTI file. This can result in a lack of colour depth information, especially if the tonal values are similar.
In order for the RTI software to work correctly, each image captured needs to be processed to create these surface normals. This is completed in the processing phase within the creation of the RTI file, where each relevant light position is calculated per image. The location and generation of the light-source used varies depending on the RTI method used. This will either be given to the processing software via a known light position file or these values will have to be calculated when unknown, through an extra step in the processing.
Tools for RTI capture and processing
One of the benefits of the RTI method is its accessibility. There is no need for advanced or expensive equipment as basic photography tools can be used.
Images for RTI can be acquired using two methods. One is to use a fixed set of lights, known as a “dome setup” (Figure 2). With this method, the lights are in fixed positions and do not change. Therefore, the calculation of their positions is not required, as the same location information can be used within the RTI processing. In other words, each light position is known, and these values can be used repeatedly. This method allows for faster capture and processing speeds, but requires all objects to be brought to the dome. The size of the recorded object is also limited and is defined by the size of the dome.
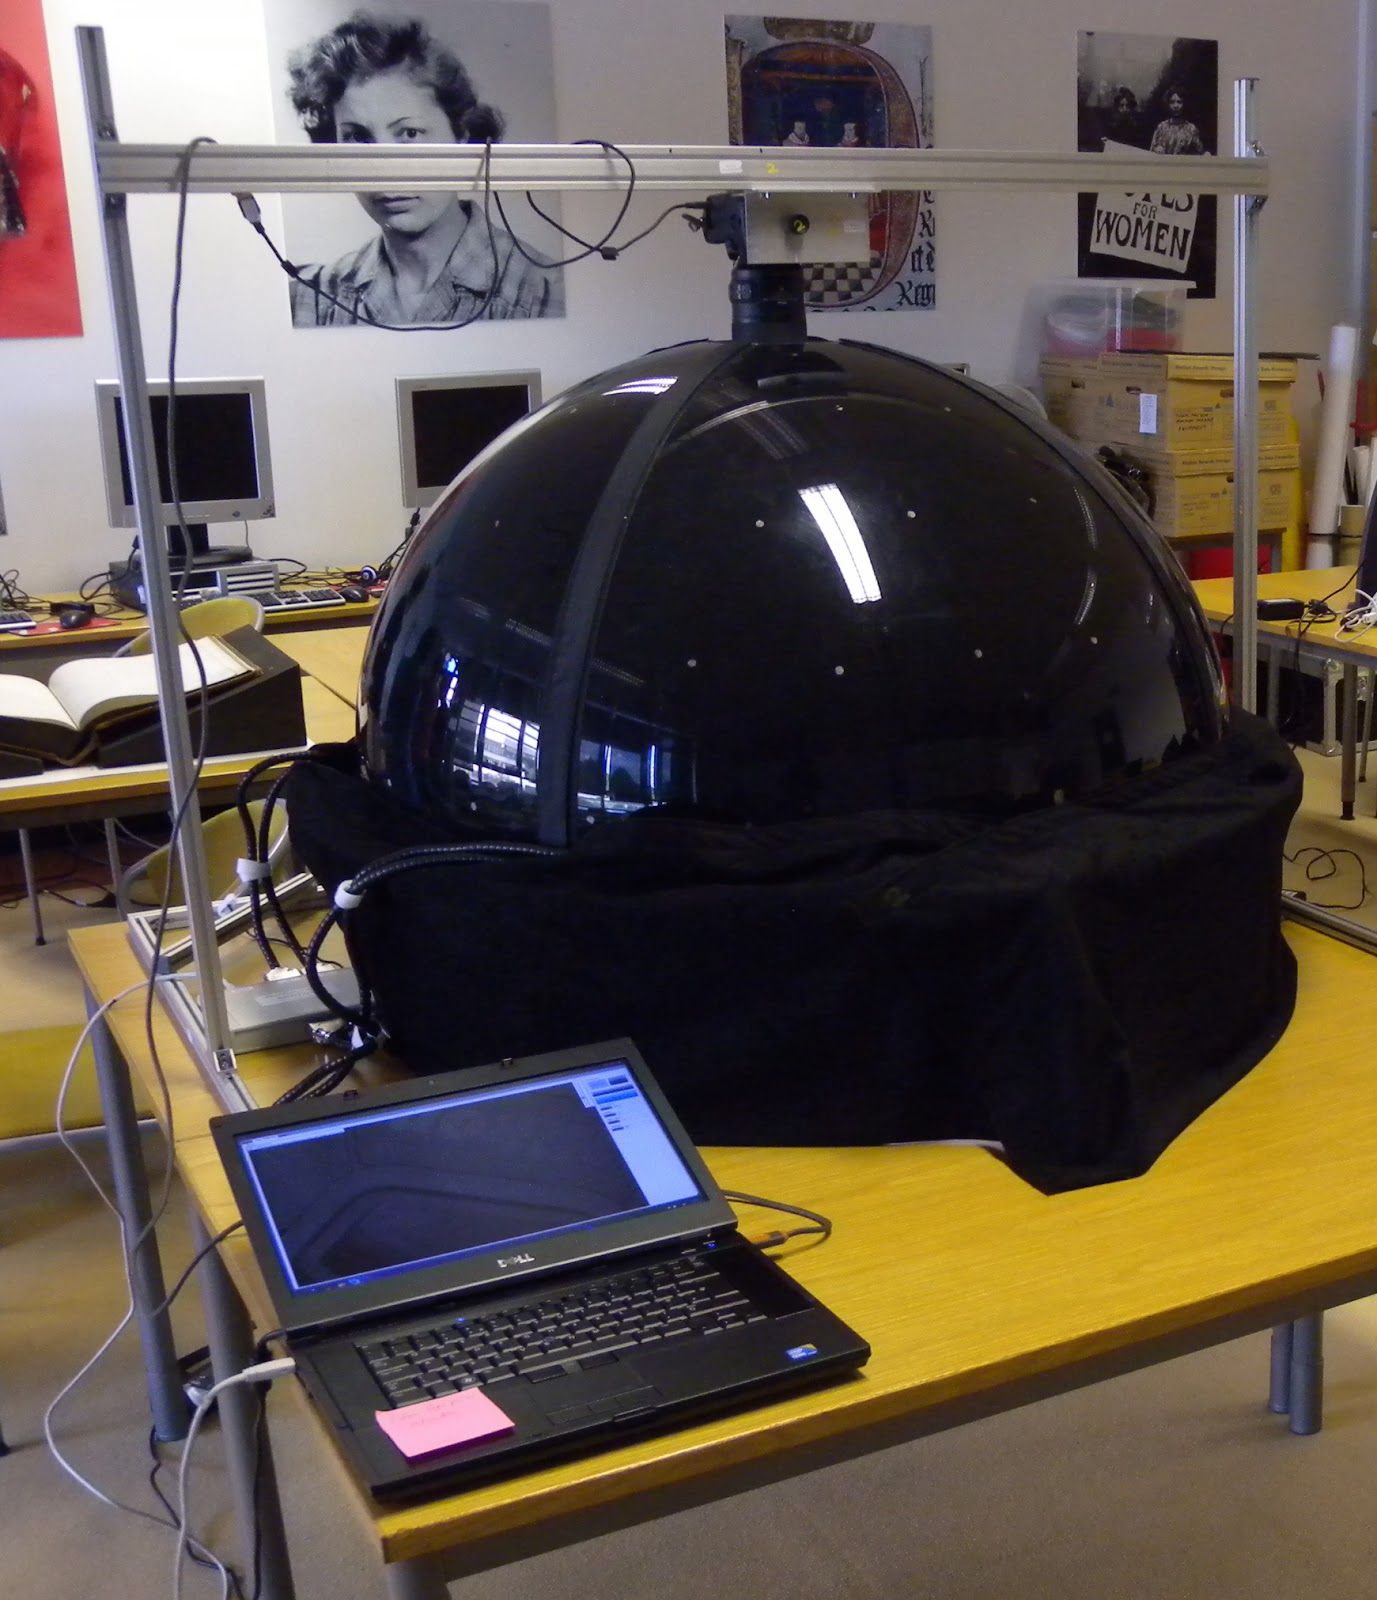
The second method of capture is known as Highlight RTI (HRTI). In this method, the light positions are unknown and need to be calculated. In order to generate surface normals, a shiny spherical ball is used within the capturing process to create a highlight on the spherical surface (Figure 3). This highlight is then extracted in the processing software, which uses the highlight spot to determine the light-source location based on the curvature of the shiny sphere. As a result, only a single light is needed. This method provides flexibility in terms of the sizes of objects that can be recorded, provided that the light-source is positioned at a distance of at least three times the longest length captured. As this method works via a camera and a single light-source, areas as large as rock art panels, or as small as those under a microscope, can be captured, with the main difference in the capture process being the power of the light used.
The main tools for RTI capture are (Figure 4):
● SLR camera
● Reflective spheres (snooker ball, ball bearings)
● Light-source (flash or continuous)
● Piece of string (for keeping the distance)
● Colour reference card (optional)
● Calibrated meter / ruler (optional)
The processing of the images is completed through open source software known as RTI Builder and the results are viewed in the RTI Viewer. The software, as well as user and capture guides are available from the Cultural Heritage Imaging website [10].
RTI for daguerreotypes
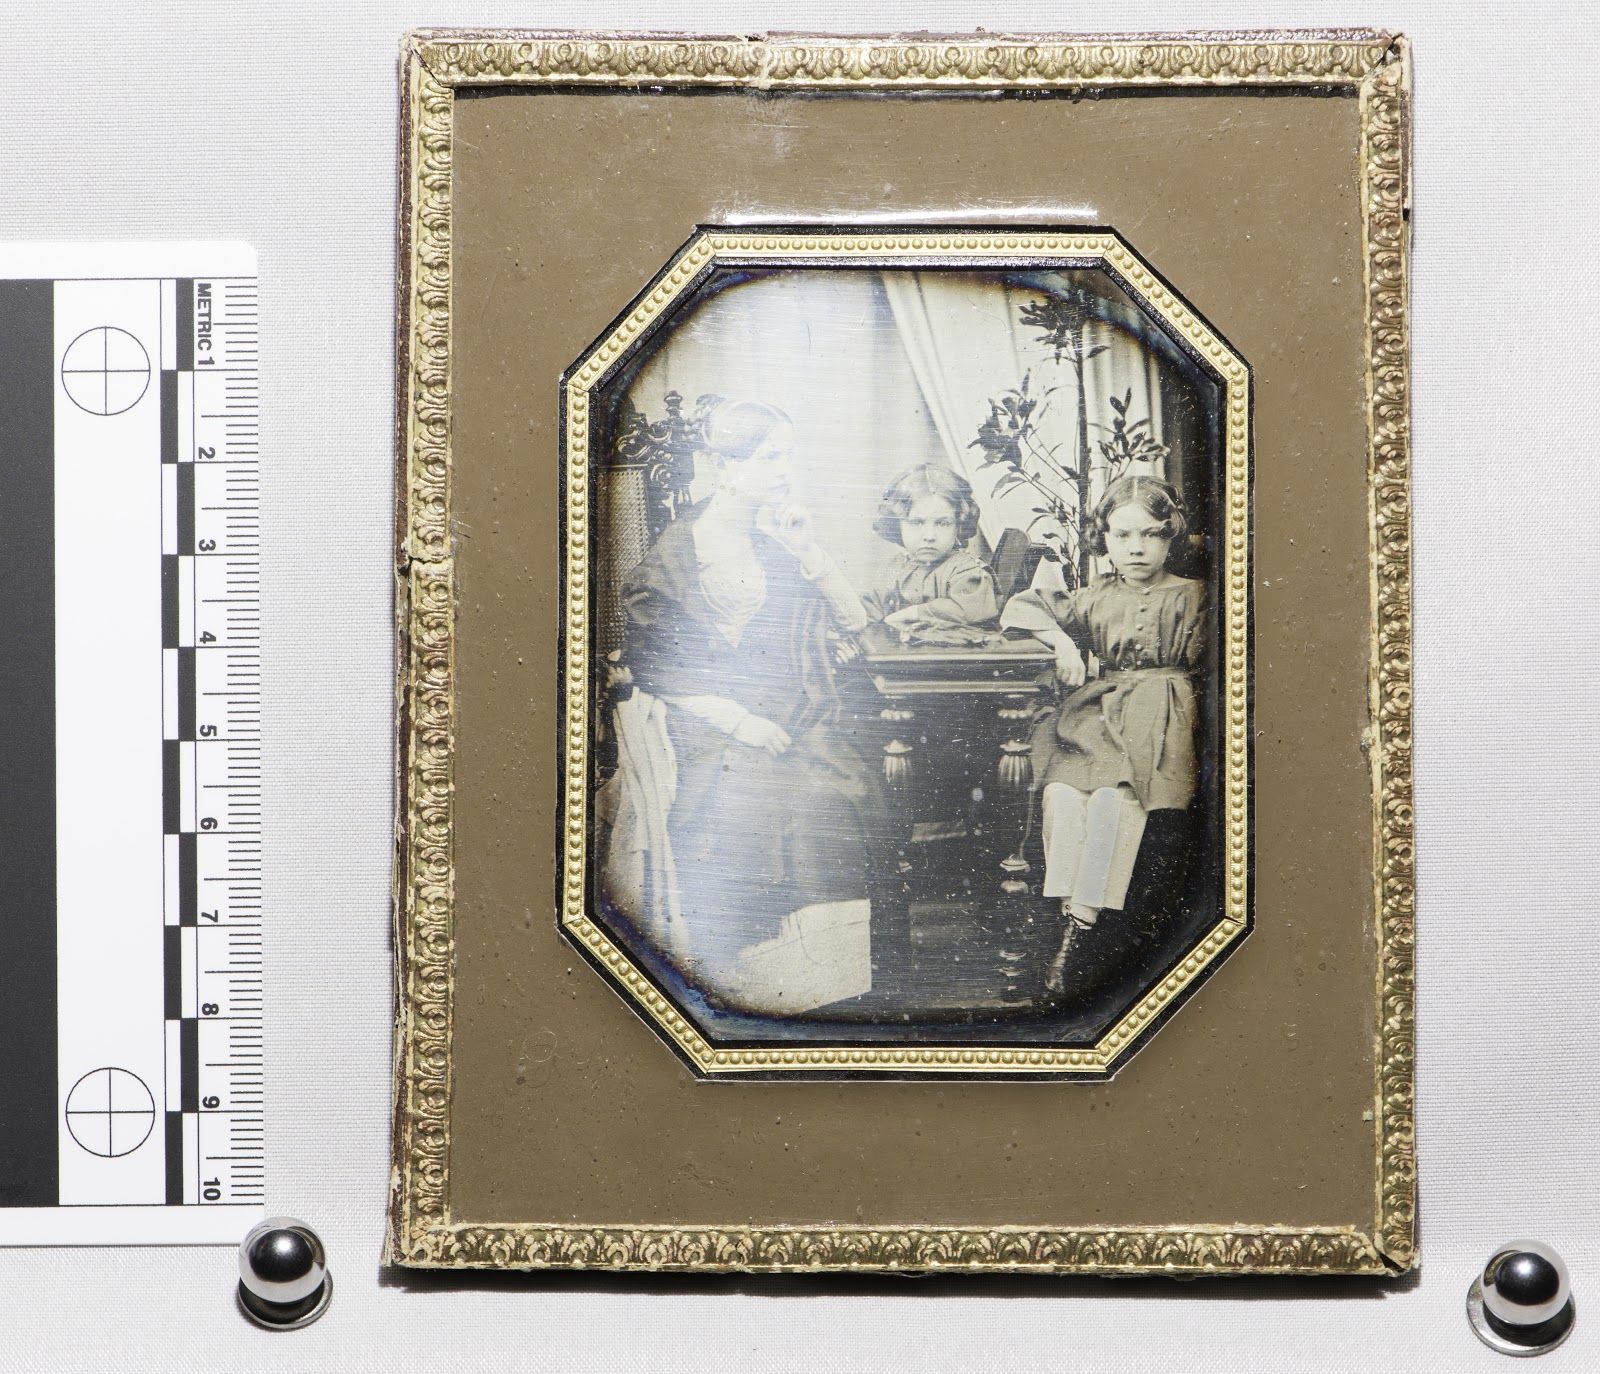
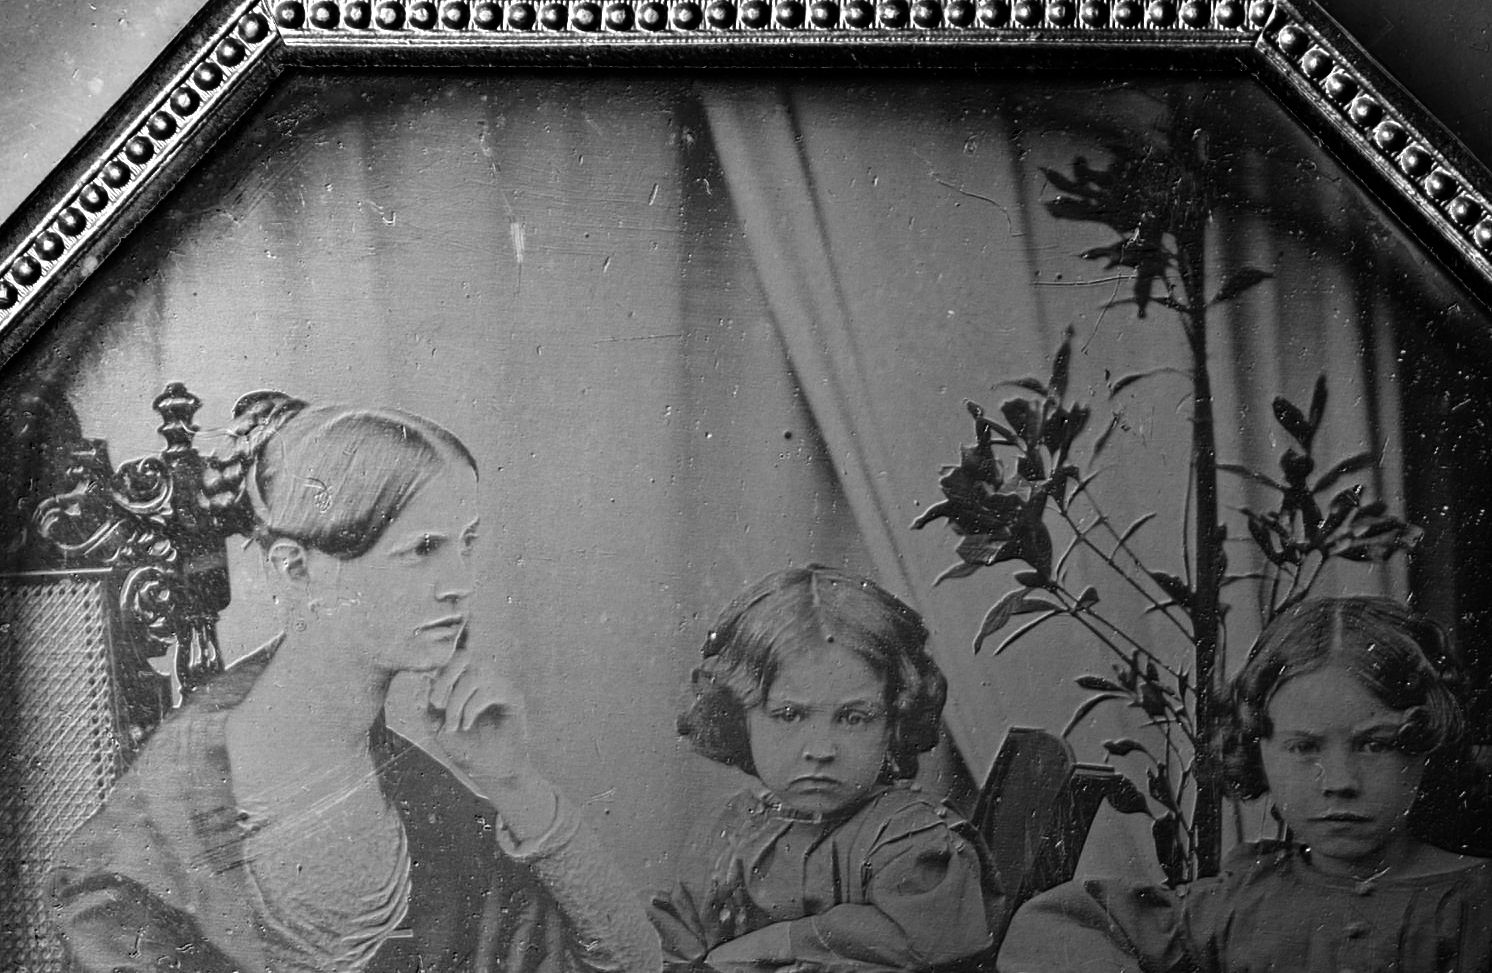
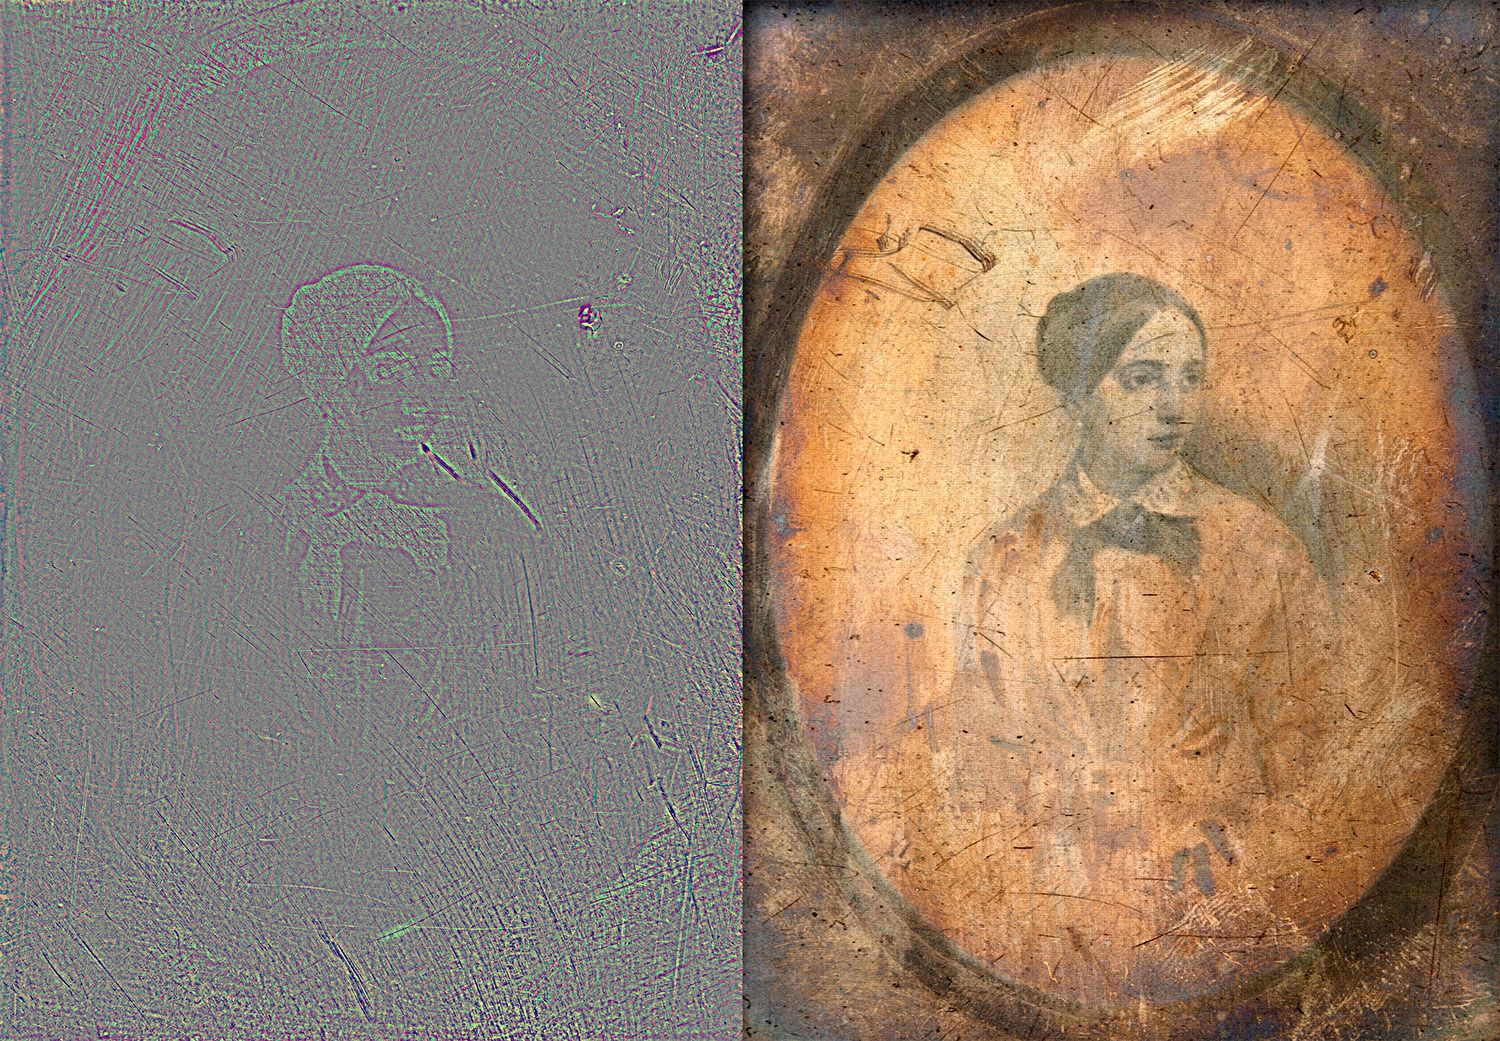
Daguerreotypes were invented by L.J.M. Daguerre in 1839 and were the first publicly available photographic process, being regularly used for almost twenty years. Daguerreotypes are made from a sheet of silver plated copper that has been polished to a mirror finish. These sheets of copper were then treated with fumes that made the copper sensitive to light, allowing for an image to be recorded based on the available light. These copper plates were then treated with a chemical liquid to remove further light sensitivity with the results being a delicate and fragile image covered by a protective glass enclosure. Without this glass covering, the image could easily be damaged and the material recorded could be lost.
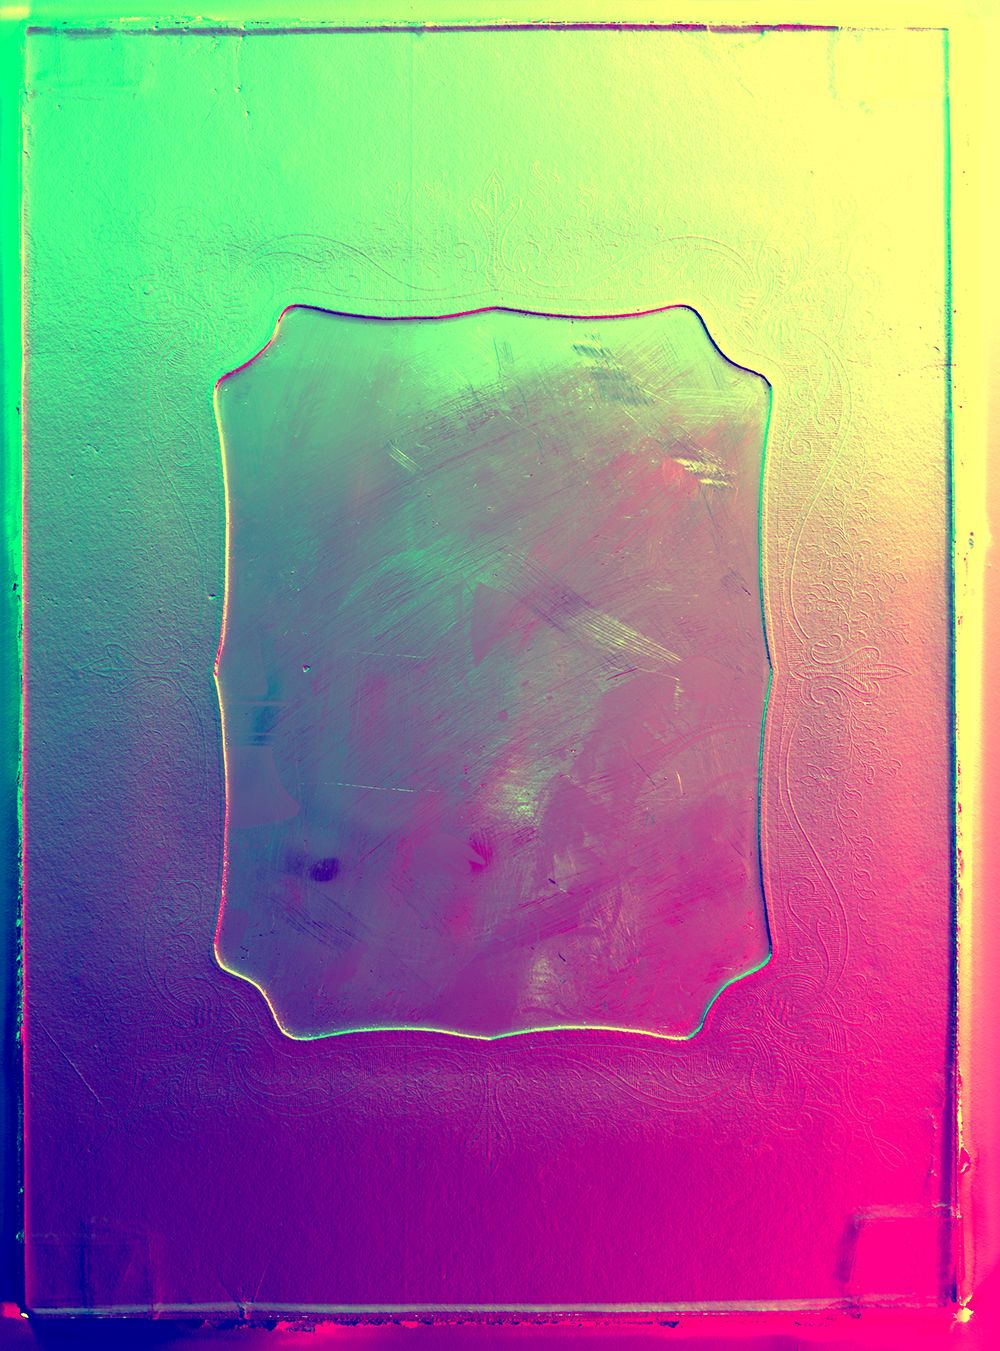
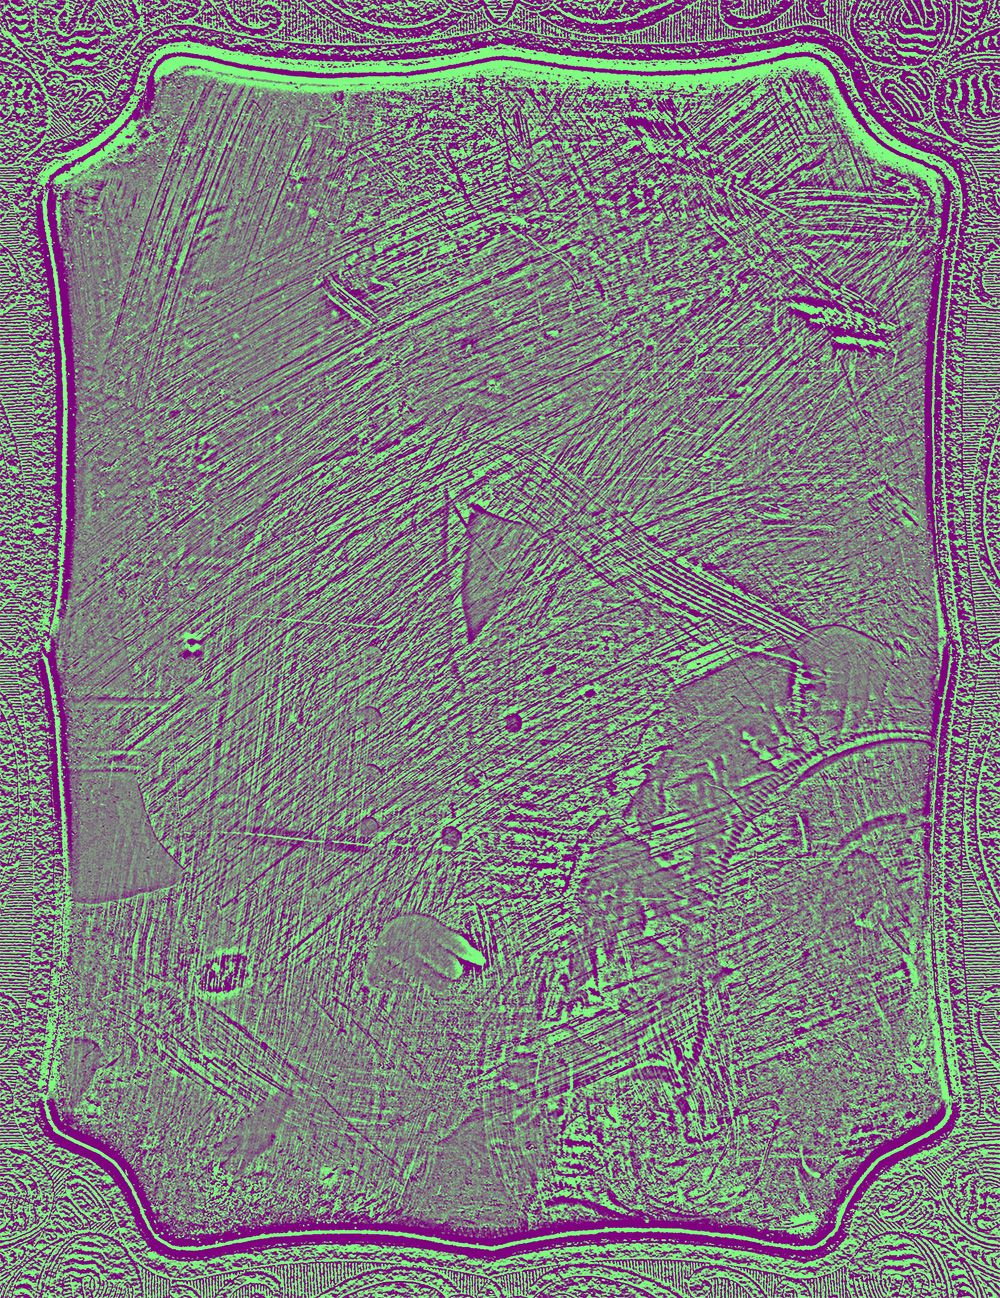
The use of RTI provides conservation specialists with a new approach in gathering additional information about the daguerreotype processing methods and the condition of these fragile artefacts. One such example can be seen in the polishing lines that run parallel across the surface of the silvered copper plate and are only visible under raking light (Figure 5). With the addition of RTI visualisation, the 3D nature of the object is exaggerated, enabling a conservator to inspect the surface of the plate more closely. The method allows for areas to be zoomed into and detailed views of tool marks, hand colouring, hallmarks, tarnish, scratches, biological growth, surface dust, and accretions can be viewed. RTI therefore makes condition recording more accurate, and can prevent damage caused by handling the original object as the method is noninvasive.
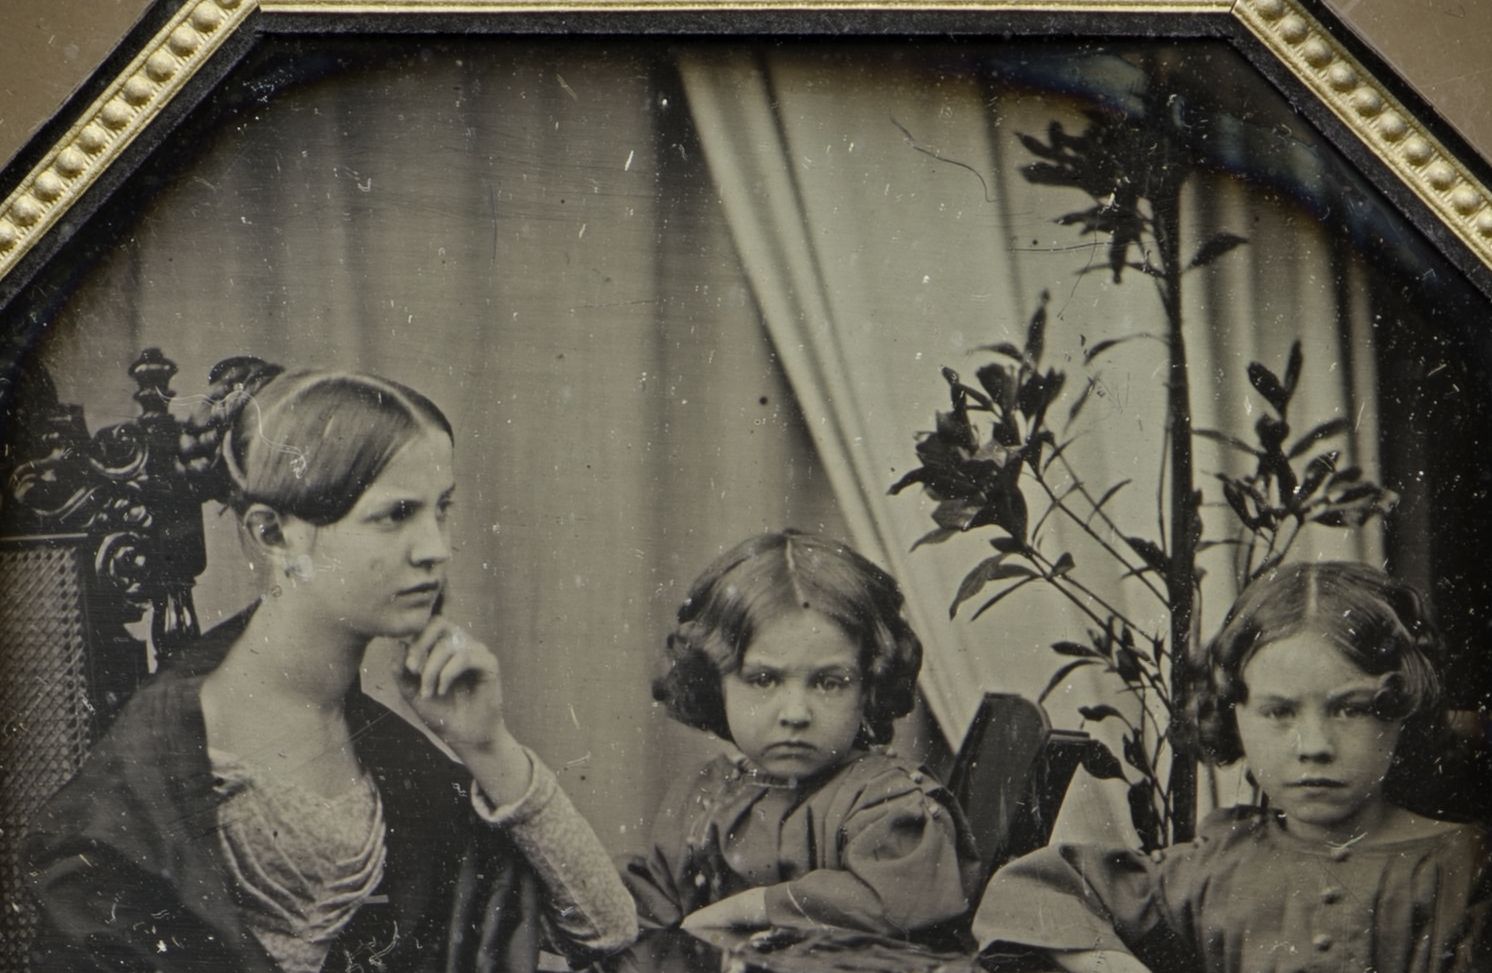
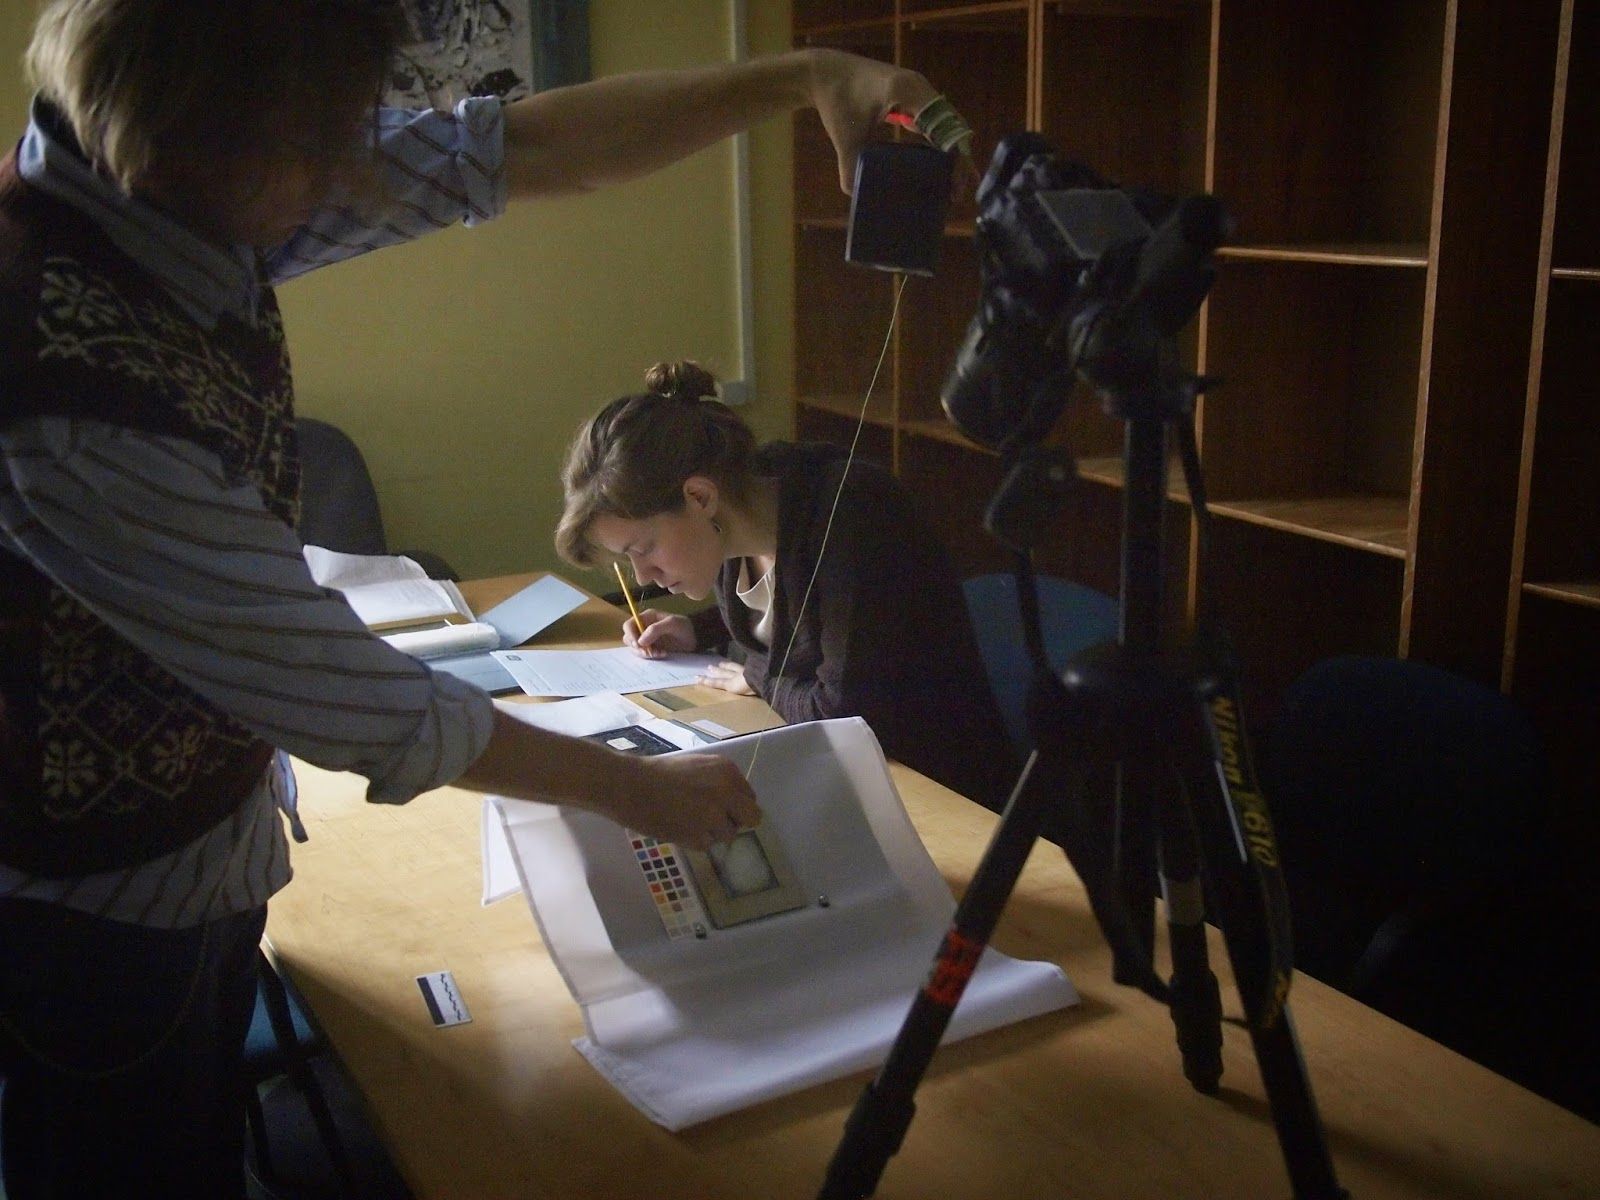
There are however, many problems when capturing daguerreotypes. Daguerreotypes are reflective in nature and are more likely to record reflections of ambient light that are normally removed during the capture process. The addition of a protective glass covering, which can include scratches and dust, makes the recording process more difficult due to the addition of further reflective qualities, as well as the introduction of unwanted shadowing. As the surface detail is reflective, extra care must be given during the recording procedure to verify that no external lightsource (such as ceiling lights), other than the one intended, is captured within the data. Great care must also be taken when setting the camera up for recording, as the majority of the ambient light can be removed by changing the aperture of the camera, or the value of the image sensitivity. Removing as much ambient light as possible prevents the processing software from including unwanted material in the final RTI file. The inclusion of these extra reflective features may produce erroneous data in the final results, and could invalidate any interpretations made.
As a possible solution to this reflective issue, Webb and Wachowiak [11] used a homemade snoot to decrease the amount of reflections recorded (Figure 3) within the photographs. The inclusion of the snoot resulted in covering the surface detail that is required within a RTI dataset and this method is not appropriate. Rather, to move away from using added material, with an already difficult to capture object, a series of low angled light position photographs were taken as these produce the strongest surface shadow features. Capturing these low angled light positions also remove the majority of the reflection issues discussed, as these are only evident when higher light angled photographs are taken. As such, the capturing process used within this investigation focused on creating the least amount of flare and reflection, with only the best angled photographs used with the generation of the RTI dataset.
RTI Algorithms
After creating the RTI dataset, a number of algorithms were used to digitally relight the daguerreotypes to enhance the features found. These included diffuse gain, specular enhancement (Figure 6), and coefficient unsharp masking. Each algorithmic rendering mode provided new insights into the features found, with the focus of examination based on the identification of dents, scratches, polishing lines, accretions, signs of hand colouring and previous cleaning.
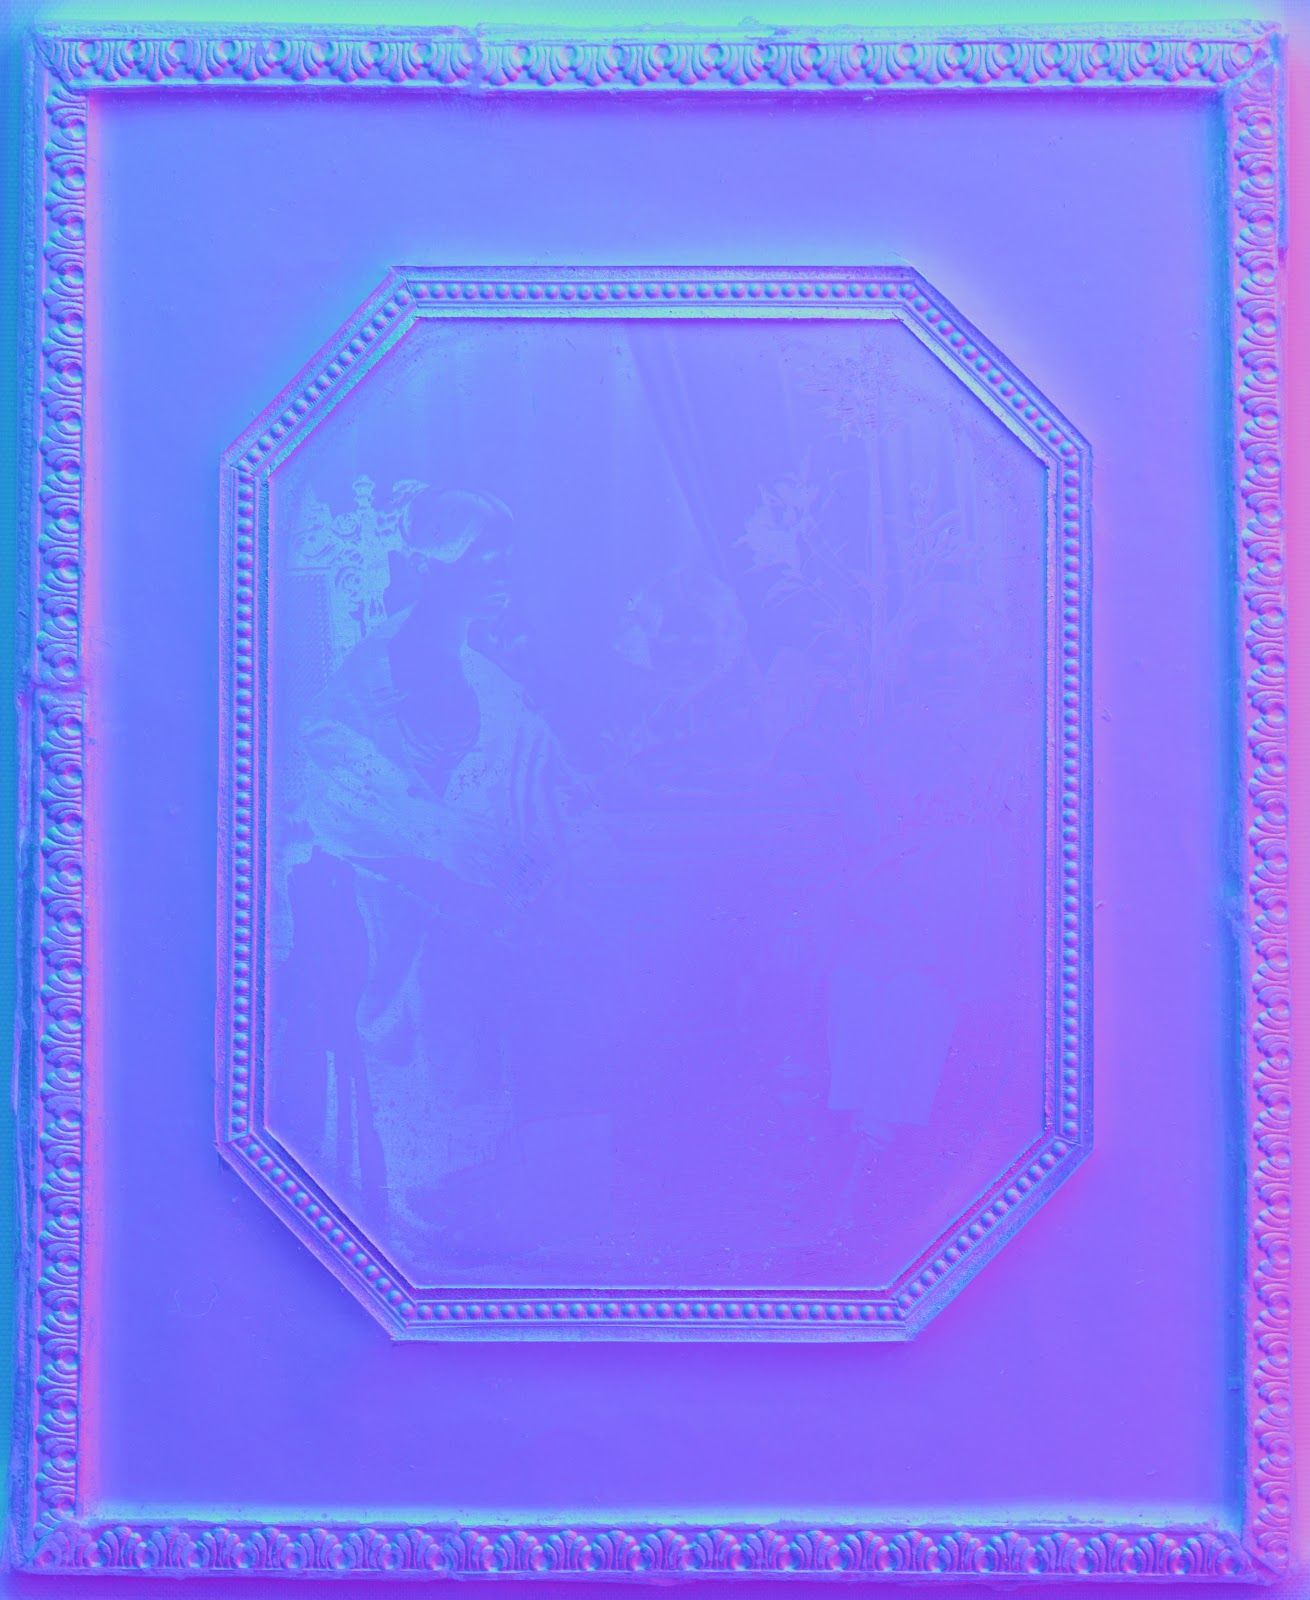
Further to the usual rendering modes used within RTI examinations, an additional algorithm was used that extended the Normals Visualisation by adding a magnification factor to each of the colours assigned to the surface normal vector components. This allowed for the data to be amplified, and enabled small changes in the position of the surface normal vectors across the whole image to be viewed. As an additional feature using this process, curve profiles across the image (Figure 7) can be extracted, therefore providing a valuable tool in understanding the flatness of the daguerreotypes below the glass covering.
If a daguerreotype contains features that have a surface normal deflection that are very small in comparison to the curve profile, the magnification of the curve profile will unfortunately obscure any identification of these features. To compensate for this, a mathematical projection which digitally removes the curve profile can be applied, whilst at the same time leaving the features for analysis (Figure 8). This process is completed by selecting a radius which is significantly larger than the size of the features analysed, but still small enough that this covers a single curve, should there be multiple intersecting curves. For each pixel, calculations of a local average surface normal for that point, based on the surface normals within the overall given radius, are produced. These results are then projected by adjusting the pixel’s surface normal by a correction factor obtained from comparing the calculated local average normal with the value of a given axis. This creates a layering approach whereby the magnified normals visualisation results are enhanced with different amplified colour channels. As a result, the resulting projection significantly improves the signal-to-noise ratio, and signifies that the feature magnification can be significantly improved. This feature magnification enhancement is beneficial in daguerreotype analysis, as enhancing the normal visualisations enables greater control over how minute and subtle surface features, which would normally be missed during normal RTI investigation, can be shown.
As daguerreotypes are reasonably flat with fine features, magnifying the surface normals brings out the highest resolution. On objects which have a greater depth, or have more heavily defined features, applying this projection to a specular enhancement or deriving the slopes of the vector normals can also produce results that are of benefit (Figure 9).
Conclusion
RTI, as shown in the case study of the Estonian daguerreotype documentation project, is a way to interactively visualise the surface of the daguerreotype to bring out very small surface details, such as scratches and polishing lines which run parallel across the surface. The method is accessible and easy to use, and with enhanced algorithms now being produced to identify new features, RTI provides new scope within conservation practices of daguerreotypes.
References
[1] H. Ruhemann, “Criteria for distinguishing Additions from Original Paint,” Studies in Conservation, vol. 3, pp. 145-161, 1958/10/01 1958.[2] T. Malzbender, D. Gelb, and H. Wolters, “Polynomial texture maps,” presented at the Proceedings of the 28th annual conference on Computer graphics and interactive techniques, 2001.
[3] J. S. Hamiel and J. S. Yoshida, “Evaluation and application of polynomial texture mapping in the area of shoe and impression evidence,” Journal of Forensic Identification, vol. 57, pp. 414-437, 2007.
[4] G. Earl, P. J. Basford, A. S. Bischoff, A. Bowman, C. Crowther, M. Hodgson, et al., “Reflectance Transformation Imaging Systems for Ancient Documentary Artefacts,” presented at the Electronic Visualisation and the Arts, 2011.
[5] K. E. Piquette, “Scribal Practice and an Early Dynastic Stone Vessel Inscription: Material and aesthetic implications,” in A Good Scribe and an Exceedingly Wise Man: studies in honour of W.J. Tait A. M. Dodson, J. J. Johnston, and W. Monkehouse, Eds., ed London: Golden House Publications, 2014, pp. 241–250.
[6] M. Mudge, J.-P. Voutaz, C. Schroer, and M. Lum, Eds., Reflection transformation imaging and virtual representations of coins from the hospice of the grand St. Bernard (VAST 2005: 6th International conference on Virtual Reality, Archaeology and Intelligent Cultural Heritage. Oxford: Taylor & Francis, 2005, p.^pp. Pages.
[7] G. Beale and N. Beale, “Community-Driven Approaches to Open Source Archaeological Imaging,” in Open Source Archaeology: Ethics and Practice, A. T. Wilson and B. Edwards, Eds., ed Berlin, Germany: Walter de Gruyter GmbH & Co KG, 2015, pp. 44-63.
[8] M. Diaz-Guardamino and D. Wheatley, “Rock art and digital technologies: the application of Reflectance Transformation Imaging (RTI) and 3D laser scanning to the study of Late Bronze Age Iberian stelae,” MENGA. Journal of Andalusian Prehistory, vol. 4, pp. 187-203, 2013.
[9] J. Miles, M. Pitts, H. Pagi, and G. Earl, “New applications of photogrammetry and reflectance transformation imaging to an Easter Island statue,” Antiquity, vol. 88, pp. 596-605, 2014.
[10] Cultural Heritage Imaging. (2015, 4th February). What we Offer. Available: http://culturalheritageimaging.org/What_We_Offer/Downloads/
[11] E. K. Webb and M. Wachowiak, “Imaging Studio Technical Note : Flexible Solutions for Reflectance Transformation Imaging (RTI),” Smithsonian Museum Conservation Institute, Ed., ed: Smithsonian Museum of Conservation Institute, 2011, pp. 1-4.
Author Biographies
Hembo Pagi has studied archaeology and technologies related to cultural heritage. His professional background comes from information technologies where he has been working over two decades. After studies at the University of Southampton he focused on imaging technologies and is co-founder of Archaeovision.
Andres Uueni has worked in different memory institutions, designing, developing information systems and led many cultural heritage digitization and documentation projects. Andres is co-founder of Archaeovision and he has started a PhD program with the Estonian Academy of Arts which focuses on cultural heritage 3D documentation and multispectral imaging.
James Miles has recently completed his archaeology PhD at the University of Southampton. He specialises in computational processes within archaeology, with an emphasis on three-dimensional and surface based recording, including laser scanning, computed tomography and RTI. His PhD focused on the use of engineering within archaeological simulation where a number of recording processes were used. He is also a director of Archaeovision, and takes a lead on all UK based work completed by Archaeovision.
Stephen Hogarth is a Professional Engineer who received his BSc in Software Engineering from the University of Alberta, Canada (2012). He specializes in scientific and technical computing. Located in Calgary, Canada, he is currently employed building reservoir simulation software for the oil and gas industry.
Kadi Sikka obtained her Master’s Degree in Cultural Heritage and Conservation, specialising in Photography, from the Estonian Academy of Arts (2014). Since 2013, she has been working at the Film Archives of the National Archives of Estonia, Tallinn, where she is responsible for the care of the film and photographic collection. As a board member of the Estonian Photographic Heritage Society, she has focused on history and preservation of photographic heritage in Estonia.